What are credit impulses and why should you care?
First, let’s focus on China’s credit impulse, as that tends to get the most attention
This chart shows the %YoY change in Chinese credit outstanding. It’s still close to 10% - so not much to worry about? (1/17)
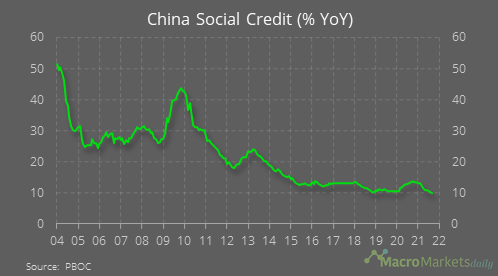
No, because looking at the change in the STOCK of credit is not all that useful when it comes to judging what might happen in the economy. That’s because GDP measures the FLOW of spending. We therefore want to know the change in the flow of credit, not the stock. (2/17)
In case that’s not clear, consider a simple example: Say I have no income and must borrow to spend. Last year I borrowed $10 and so spent $10. This year, I borrow another $5. My debt (stock of credit) goes up by 50% to $15, but my annual spending goes down by 50% to $5. (3/17)
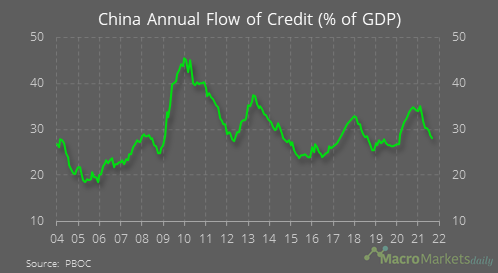
Here is the annual flow of credit for China, expressed as a percent of GDP. Notice how different it looks to the YoY% chart. (4/17)
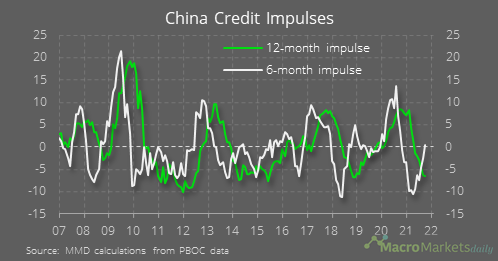
The credit impulse* is the change in the flow of credit. In China, annual flow of credit in Sep.20 was 34% of GDP.This Sep, 28%. So the 12-m credit impulse is -6.
*Some refer to the flow of credit as the CI, & would label the below chart as the “12-mth change in the CI” (5/17)
What about other countries? Those are important, but look at the US credit impulse if we plot it on the same y axes as used for the China chart above. You can see that the change in the flow of credit in the US is normally much smaller relative to GDP (6/17)
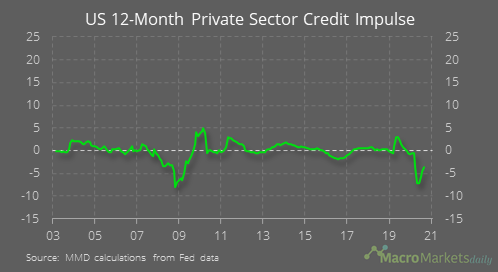
At a global level, it’s normally always credit trends in China that have the largest bearing on the global credit impulse - the GFC was a key exception when all other economies saw credit tighten sharply. (7/17)
Why should you care? Many reasons! - there are several relationship charts coming now. If you’ve seen these before, skip to the end for some concluding comments
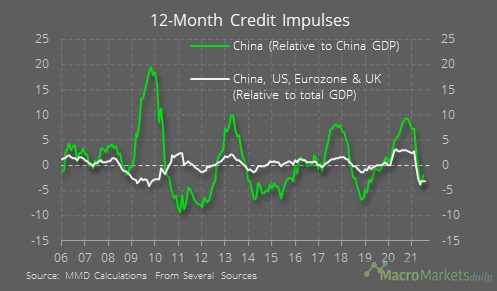
First, the credit impulse is a key driver of the global economic cycle: (8/17)
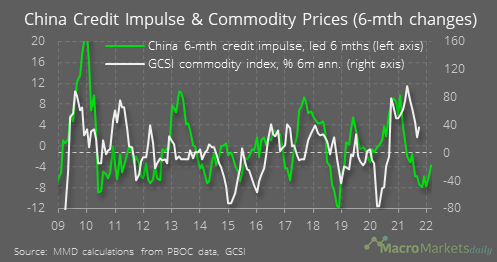
With China a big buyer of commodities, the CI teads to lead commodity prices too - oil can make a big difference to whether this relationship works. The relationship didn’t work during the 2014/15 oil price crash, and not too well now as supply issues keep prices up (9/17)
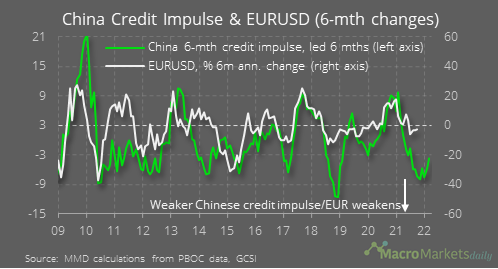
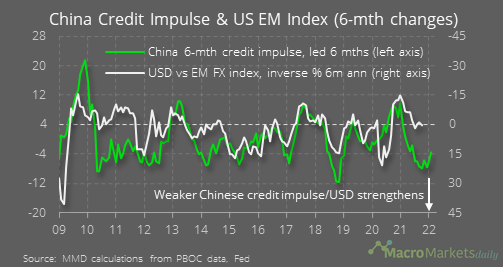
There has also historically been links between the credit impulse and EURUSD (10/17)
And also EM FX:(11/17)
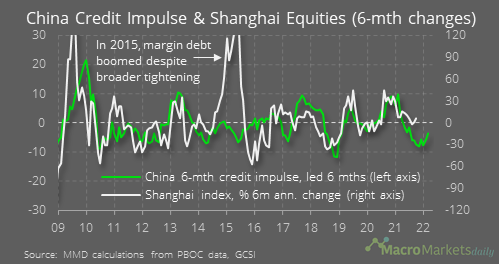
Unsurprisingly, often a big deal for Chinese equities: (12/17)
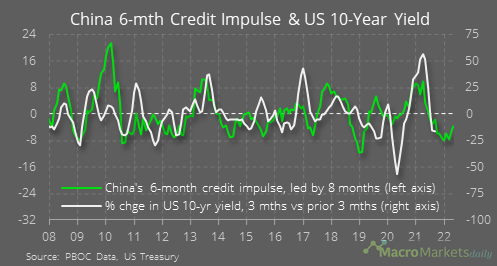
And finally in terms of relationships, not forgetting that China’s credit conditons seem to play a role in driving US bond yields, perhaps also due to the influence on commodity prices: (13/17)
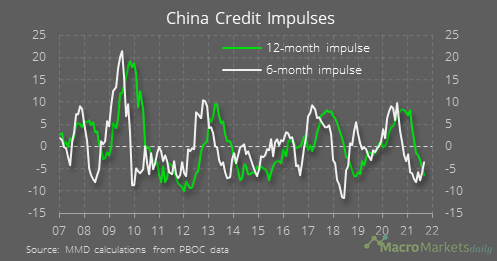
Ok, so now China’s 6-m credit impulse is heading to neutral again, soon we can stop talking about it?
Erm…well look at this: China’s debt has surged to levels normally only seen in AEs. That limits the capacity for China to take on more debt for future development: (14/17)
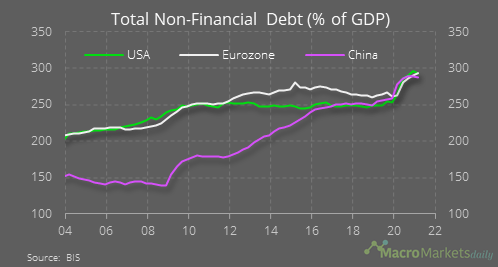
As the 2nd chart displayed, China’s flow of credit is still close to 30% of GDP per yr. The IMF expects nominal GDP growth to be a much lower 8% YoY from here, meaning the total debt-to-GDP ratio will keep rising unless China clamps down sharply on credit growth. (15/17)
If debt-to-GDP keeps rising, meaning debt rises at a faster pace than the ability to service that debt, eventually the financial sector could face serious problems that make Evergrande look cute. (16/17)
So best case here are future gradual contractions in the flow of credit in China to put debt on a more sustainable path, and worst case is that we face a big credit shock in the future. (17/17, end)